KEY POINTS
- Effective PLM Analytics is challenging owing to the complex data structures that lie underneath
- Data analytics in principle is more about the data than the tool. The tool should be able to elicit, analyze and contextualize the data available to develop useful reports
- Disparate reporting doesn’t usually give the big picture. EXALEAD has the ability to pull data from different disparate sources to aid is more effective and efficient reporting
- BI Tools are competent to represent rich information, but EXALEAD adds “context” to these reports which enhances decision making
Introduction
Analytics is more of an art than science. The right interpretation of data paves the way for good and
informed decision making. The familiarity of pure Business Intelligence tools assists in analyzing and
interpreting both structured and unstructured data to aid in decision making.
Analytics with product-design data in that way is one step more complicated because it involves
analyzing engineering design data which is by nature more complex and sometimes incomplete as well.
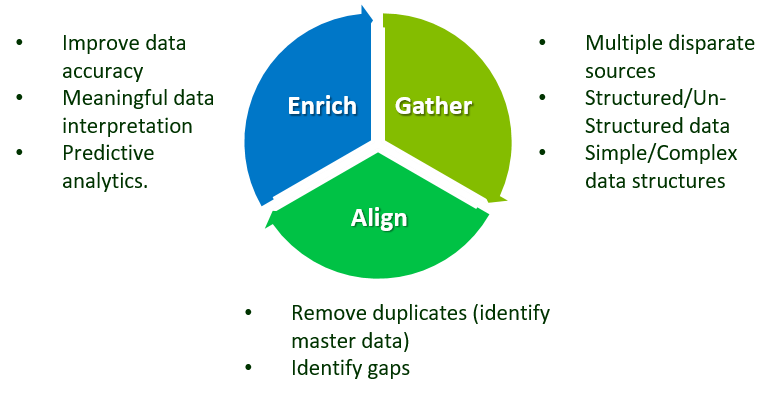
Data analytics follows a simple 3 step cycle – Gather, Align, Enrich – The differentiation comes in how
each of these steps are designed and implemented. Reusable tools and accelerators coupled with good
understanding of business and related data paves the way for an effective solution implementation.
 EXALEAD
 offers an effective solution which addresses some of the peculiar challenges of PLM. The need to
increase part reuse, addressing new markets, usage of new materials, and new technology – all re-iterate
the need for effective, efficient and intelligent analytics solution
Making sense of “Engineering”
In any manufacturing organization, PLM application landscape forms the integral part of their overall
application landscape. Making sense of their “engineering” data forms the first step in a product
development lifecycle. Similarly managing a change effectively for a product ensures traceability as
well as reduces product defects and failures.
A good analytics solution understands the underlying engineering data and interprets the right
information to aid in decision making. Some of the examples include:
- Supplier consolidation through parts reuse and identifying standard parts
- Identifying which change cycles (Open ECRs and ECOs) are longer and devise strategies to
optimize them.
- Visualize real-time status of different projects within the company to get insights on
quality, capacity, gap-to-target analysis etc
This is an indication that, while the data is available in single or multiple sources, there is
significant effort involved in understanding the relationships between the data and interpreting it
meaningfully. This is where the experience of implementing such solutions for various customers proves
beneficial
The Problem Statement

A subsidiary of an Oil and Gas major had almost 20+ (Excel, CSV, JDBC – databases, etc.) systems
capturing Fragmented Data of different project functions/activities. The major challenges faced with
this kind of setup were:
- No single source of truth – It was very difficult to get an integrated view of all the
projects
- No single source of truth – It was very difficult to get an integrated view of all the
projects
- Inefficient decision making – with data spread across multiple systems workflows were
inefficient, decision making was time consuming and data reports were erroneous due to manual
intervention
Our Solution
The solution was intended not only to address the stated challenges, but also to provide value added
benefits. Almost 400 odd Business KPIs ranging from schedule tracking, cost, Performance, Material
Tracking, Risks etc. were modelled. The high level solution is depicted below.
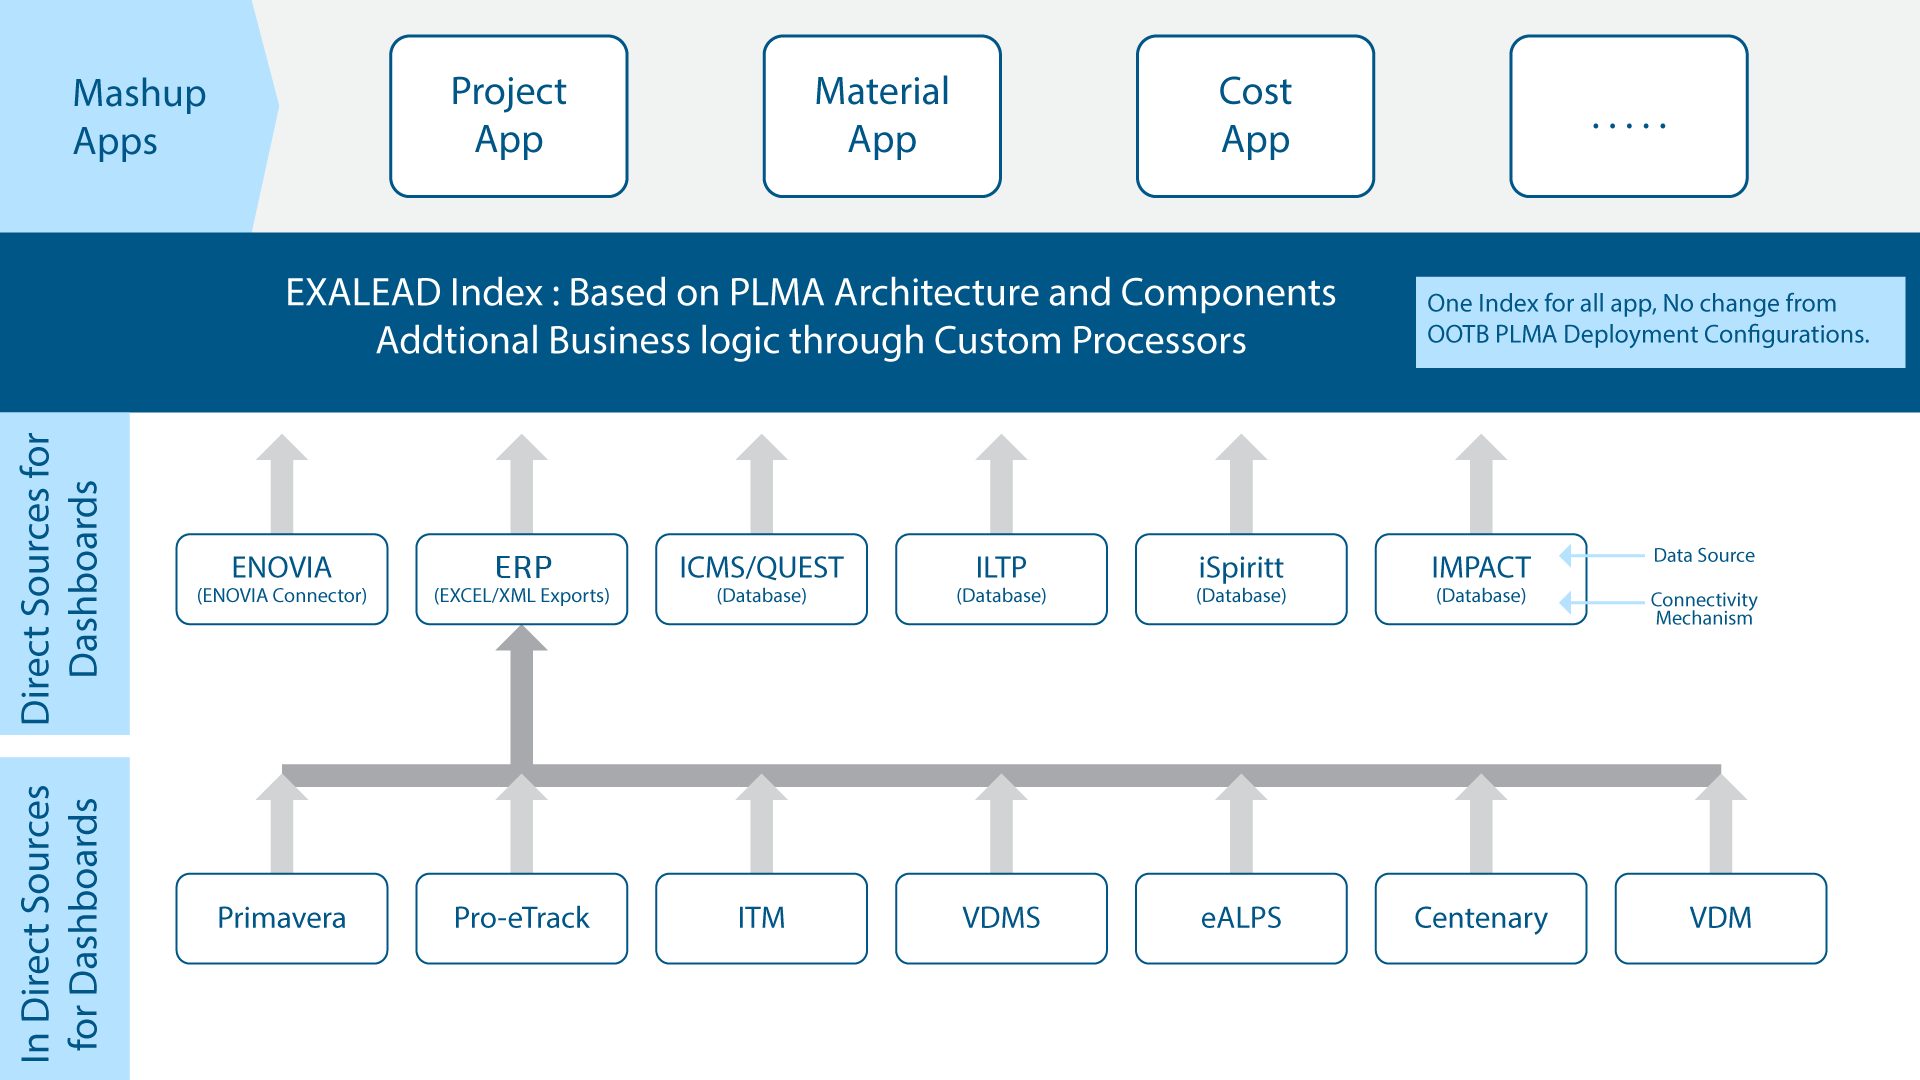 The above solution enabled the customer:
- To have a consolidated 3D Dashboard view consisting of ENOVIA, DELMIA and EXALEAD data at one
place
- To provide a 360 degree view of data at any given point in time
- To provide an interaction with 3D data as well for better and effective decision making as
compared to just metadata reports
- To enable “S-Curve” plotting for Labor Vs. Time – This depicts the health of the project
- To enable tracking and monitoring of projects at one place which provided a consolidated view
for the project stakeholders
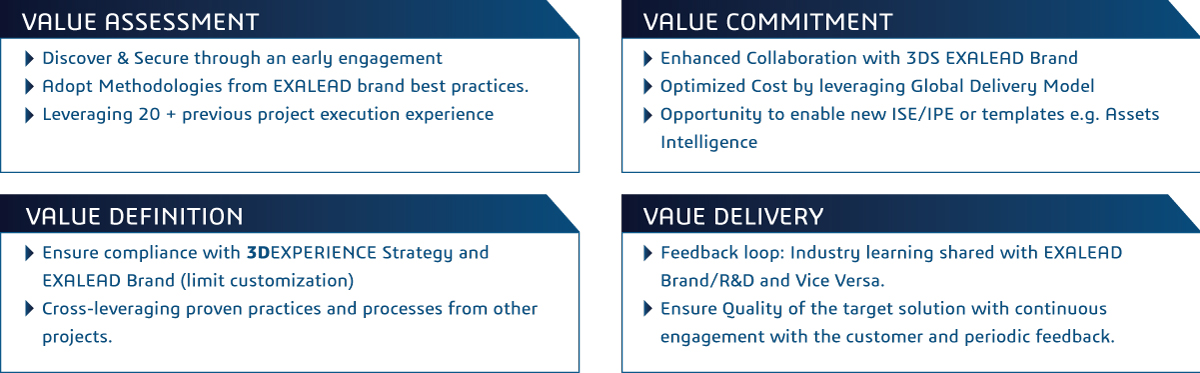
The Value Engagement Lever
The success of this PLM Analytics solution deployment was ensured by relying on our Value Engagement
Framework.
Conclusion
EXALEAD PLM Analytics reveals contextual and accurate business information to aid in decision making.
Traditional BI solutions are often based on transactional and/or structured data sources. EXALEAD on the
other hand uses business logic analysis of complex product structures and data models. It goes beyond
the capabilities of BI tools traversing relationships between different types of information and puts it
all in context.
Consider a particular business KPI – where the customer is aware, that a particular component used in
their overall product assembly is having high maintenance costs but they are unsure of what to do about
it. What is required here is insight. The answer may involve collaborating with multiple disciplines
spread across geographies and this where a solution like EXALEAD will provide a single point of access
and help in deriving insights.
From a solution implementation perspective, the differentiation lies in identifying these business KPIs,
the drivers for efficiency and the data sources – all implemented as a single PLM Analytics solution.
Mekhala GOVINDA
(Senior Program Manager)
Contributor: Ashish PIMPARKAR
IN.DSGS.Marketing@3ds.com
To know more contact